Our Modeling Approach
HOW MIGHT THE MULTIPLE FACTORS SHOWN IN THE ECOLOGICAL DROUGHT FRAMEWORK INTERACT TO DRIVE DROUGHT IMPACTS ON ECOSYSTEMS?
To answer this question, we modeled the ecological aftermath of a multi-year drought in the early 2000’s in the forests of southwestern Montana (Crausbay et al. In Prep.). We leveraged multiple spatial data sets and used machine-learning techniques to understand what made forest in different locations within these watersheds vulnerable to this specific recent drought. We followed the ecological drought framework to illustrate and quantify how different aspects of drought risk – meteorology, landscape characteristics, ecological condition, or human land and water use – drove impacts to forests, as indicated by changes in “greenness” from Landsat satellite data. Our goal with this detailed exploration of a recent ecological drought is to help drought planners and resource managers link the specific aspects of vulnerability to appropriate monitoring tools and resource management strategies. These tools and strategies are described in the Adaptation Library.
WHERE ARE WE WORKING?
Our geography and scale of analysis are aligned with drought planning efforts in the Missouri Headwaters Basin (6-digit HUC), where individual plans are being crafted for eight watersheds (8-digit HUCs) within. We constructed individual models for each watershed.
HOW DID WE PICK A SPECIFIC DROUGHT TO EXPLORE?
Once our geography was pinned to the Missouri Headwaters Basin, we examined the recent drought history in that area, and selected the most severe drought event, from 2001 - 2005.
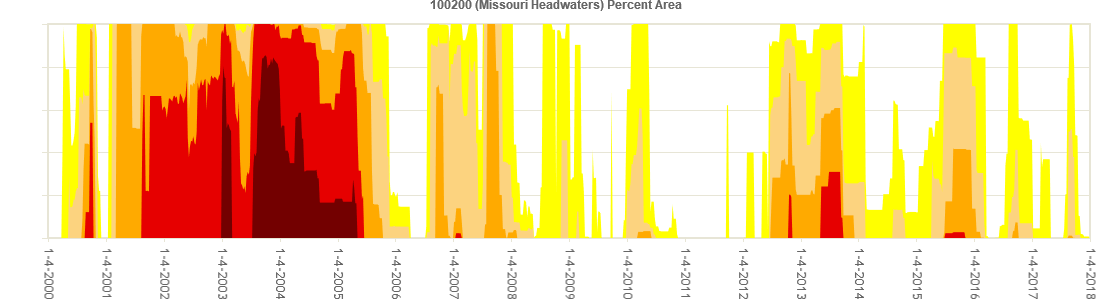
A time series of the percent area (y-axis) in the Missouri Headwaters Basin under each of five drought categories from exceptional drought (dark red) to abnormally dry (bright yellow), from the United States Drought Monitor.
HOW DID WE MEASURE FOREST IMPACTS IN RESPONSE TO DROUGHT?
We mapped ecological impacts from drought in forested lands in the Missouri Headwaters Basin with remotely sensed data representing tree “health.” This health metric was based on assessment of the linear trend of a time series of the normalized difference vegetation index (NDVI, from Landsat) across the drought’s five year duration from 2001 – 2005.. NDVI is a simple ratio of the red and near- infrared reflectance values, which is commonly used to monitor vegetation phenology (seasonal timing of leaf cover) and long-term vegetation health. High NDVI values are associated with healthy vegetation, while low NDVI values are associated with vegetation that is unhealthy and may be undergoing drought stress, or may have experienced some mortality within that 30m x 30m pixel. We interpret strong negative trends in NDVI during the drought event as evidence of drought impacts to forests.
WHAT DATA DID WE USE TO DRIVE A MODEL OF FOREST IMPACTS?
For the Missouri Headwater Basin case study model, our intent was to incorporate as many covariates from the ecological drought framework (Crausbay, Ramirez et al. 2017) as possible, so our goal was to obtain spatial data that represented climatic, ecological, landscape, and human land and water use variables. Our demonstration model was run with the following input datasets, which are briefly defined below. For each, you can find more information on the source and how it was calculated by clicking on the “i” button in the map legends within the case study page.
Ecological characteristics
- Tree canopy cover - percent tree canopy cover ranging from 0 to 100 percent, for each 30 m cell covered by tree canopy
- Vegetation type - the current distribution of the terrestrial ecological systems classification, developed by NatureServe.
Drought indices
- Evaporative Demand Drought Index (EDDI) - a measure of the evaporative demand of the atmosphere, which influences water lost through leaf tissues and soils.
- Landscape Evaporative Response Index (LERI) - a measure of the actual evapotranspiration of the land surface, considered a proxy for soil moisture.
- Standardized Precipitation Index (SPI) - a commonly-reported drought index that is based solely on precipitation data.
- Forest Drought-Stress Index (FDSI) an index linking precipitation and vapor pressure deficit to tree growth impacts.
- Snow water equivalent (SWE) - the amount of water contained in the snowpack on April 1, indicating water available to ecosystems later in the spring/summer.
- Tmax - simple seasonal anomalies in summer temperatures relative to the long-term (1981-2010) mean.
- Tmin - simple seasonal anomalies in winter temperatures relative to the long-term (1981-2010) mean.
Landscape characteristics
- Slope - the gradient of a landscape feature, which influences water movement and exposure to solar radiation (insolation).
- Aspect - the compass direction that a slope faces, which influences exposure to solar radiation.
- Continuous heat-insolation load index (CHILI) - estimate of incident radiation and heat load that combines slope, aspect, and latitude, and has a strong empirical relationship to evapotranspiration.
- Topographic position index (TPI) - an indicator derived from hillslope position and aspect that addresses the impact of insolation on soil moisture.
- Topographic wetness index (TWI) - an indicator of soil moisture derived from slope and the size of the catchment upstream of the focal location.
- Mean Climatic Water Deficit (CWD) - the 30-yr mean (1980-2009) for CWD is calculated as Actual Evapotranspiration (AET) – Potential Evapotranspiration (PET) from AdaptWest.
WHAT DATA ARE MISSING?
We were unable to find adequate datasets specific to this drought event in the Missouri Headwaters Basin for human water use, natural resource management prior to the event, or human modification to the landscape prior to the event. We found data for tree height in 2001, however the technology at that time only allowed for recognizing a category of 10-25m, and there was no variation in that category across our site. We also recognize that forest insect pests played a major role during this drought, and considered mapping bark beetle infestation as a covariate within this set of exploratory modeling We chose to leave beetles out for two reasons: (1) we were limited to coarse-scale infestation data that did not match the resolution of other datasets, and, (2) the intent of this work was to focus on drought as the ultimate cause of the observed impact, with an assumption that beetles are a proximate causal factor that are responding to this ultimate driver. We emphasize the intent of this model is to help managers and drought planners explore the complex relationships shown in our ecological drought framework. For now, finding these missing data is limited by the availability of data before 2001, so we simply recognize their importance, and maintain placeholders for them in our flower plots.
HOW DID WE MODEL THIS ECOLOGICAL DROUGHT?
We are using a machine-learning algorithm, Boosted Regression Trees (BRTs; Elith et al. 2008) to relate multiple variables, simultaneously, to the forest impacts we observed from drought. Boosted Regression trees is flexible and robust to predictor variables that are correlated with each other. We used the “dismo” package (Hijmans et al. 2013) in R (R Development Core Team 2012) and we fitted these models using the function gbm.step.
The drought event we focused here on is a multi-year drought, so we took care with the climate-based variables in the modeling. We included representations of all of the climate-based data (EDDI, LERI, SPI, FDSI, SWE, Tmax, Tmin) for the growing season in each year of this multi-year drought. Although BRTs are robust to correlated variables, many of these climate-based datasets are highly correlated, for example EDDI in any one year is correlated with EDDI in another year. We sought to avoid the influence of such strong collinearity in our models, so we first developed a set of initial BRT models to determine which year of climate-based data, is best correlated to ecological response (e.g., EDDI 2000 or EDDI 2001). Once we had a list of the best-correlated year for each climate-based variable, we then developed a BRT model using the best single predictor variable year per climate-based variable type, combined with the landscape and ecological variables. This resulted in a final BRT model with 16 predictor variables: three ecological variables, six climatic variables, and seven landscape variables.